
Maurice Müller
Senior Content Manager
Maurice Müller is a journalist and content strategist with experience across print and digital media. At Formalize, he translates complex compliance and regulatory topics into clear, practical content for compliance, risk, and security professionals across Europe.
Key takeaways:
A risk matrix plots likelihood against impact to produce a risk score. It's a tool, not a full risk management methodology on its own.
A 5×5 matrix is the most common format, creating 25 possible risk combinations across five levels of each axis.
Likelihood and impact scales should reflect an organization's own context, not a single universal standard.
Risk matrices work best as one part of a broader process, alongside a risk register, defined controls, and regular review.
A risk matrix, sometimes called a risk assessment matrix, works by combining those two things, likelihood and impact, into a single score. This guide walks through how that scoring actually works, how to build a matrix step by step, and where it fits inside a broader risk process.
Risk score = likelihood × impact
A likelihood score of 3 multiplied by an impact score of 4 produces a risk score of 12.
How does a risk matrix work?
A risk matrix works by rating each risk on two criteria: likelihood and impact. Combining the two produces a risk score. That score places the risk somewhere on the grid and signals how urgently it needs attention relative to everything else on the register.
The mechanics are simple by design. Two numbers, multiplied or added together, land in a cell. The real work happens earlier, in deciding what those numbers should actually be for a specific risk in a specific organization.
Likelihood
Likelihood represents how probable it is that a risk will actually occur, given the controls already in place. Most organizations use a qualitative scale, commonly running from 1 to 5, from rare or unlikely at one end to almost certain at the other.
A typical five-point scale might look like this:
Rare: could happen, but there's no history of it occurring
Unlikely: possible, but not expected under normal conditions
Possible: has happened before, in this organization or a similar one
Likely: expected to happen at some point, based on current trends
Almost certain: expected to happen in most circumstances
There's no single correct definition of what each level means, and that scale is only a starting point. A "possible" likelihood for a critical supplier outage looks nothing like a "possible" likelihood for a minor process error. Each organization should define its own scale in its own terms, rather than importing someone else's scale unchanged and hoping it fits.
Impact or severity
Impact reflects the consequences if a risk actually occurs. Depending on the organization, that might mean financial loss, operational disruption, regulatory exposure, reputational damage, or some combination of several at once.
A useful impact scale forces a specific question at each level: what would this actually cost, in terms the organization already tracks. That might be a euro figure, a number of hours of downtime, or a defined regulatory consequence, rather than a vague label like "bad" or "worse" that means something different to every person reading it.
Risk score and risk level
Likelihood and impact combine into a risk score, most commonly by multiplying the two numbers together. A risk scored 3 for likelihood and 4 for impact lands at 12, which then falls into whatever category the organization has defined for that range.
That range matters more than the raw number does. Some organizations use three bands: low, medium, and high. Others use four or five, adding categories like "critical" at the top end. There's no universal cut-off for where "medium" ends and "high" begins. What matters is that the thresholds get defined in advance and applied consistently, not adjusted after the fact to make a specific risk look better or worse than the process actually found.
What is a 5×5 risk matrix?
A 5×5 risk matrix uses five levels of likelihood and five levels of impact, creating 25 possible combinations. That's meaningfully more granularity than a simpler matrix offers. It makes it easier to separate a genuinely urgent risk from one that only looks similar at a quick glance.
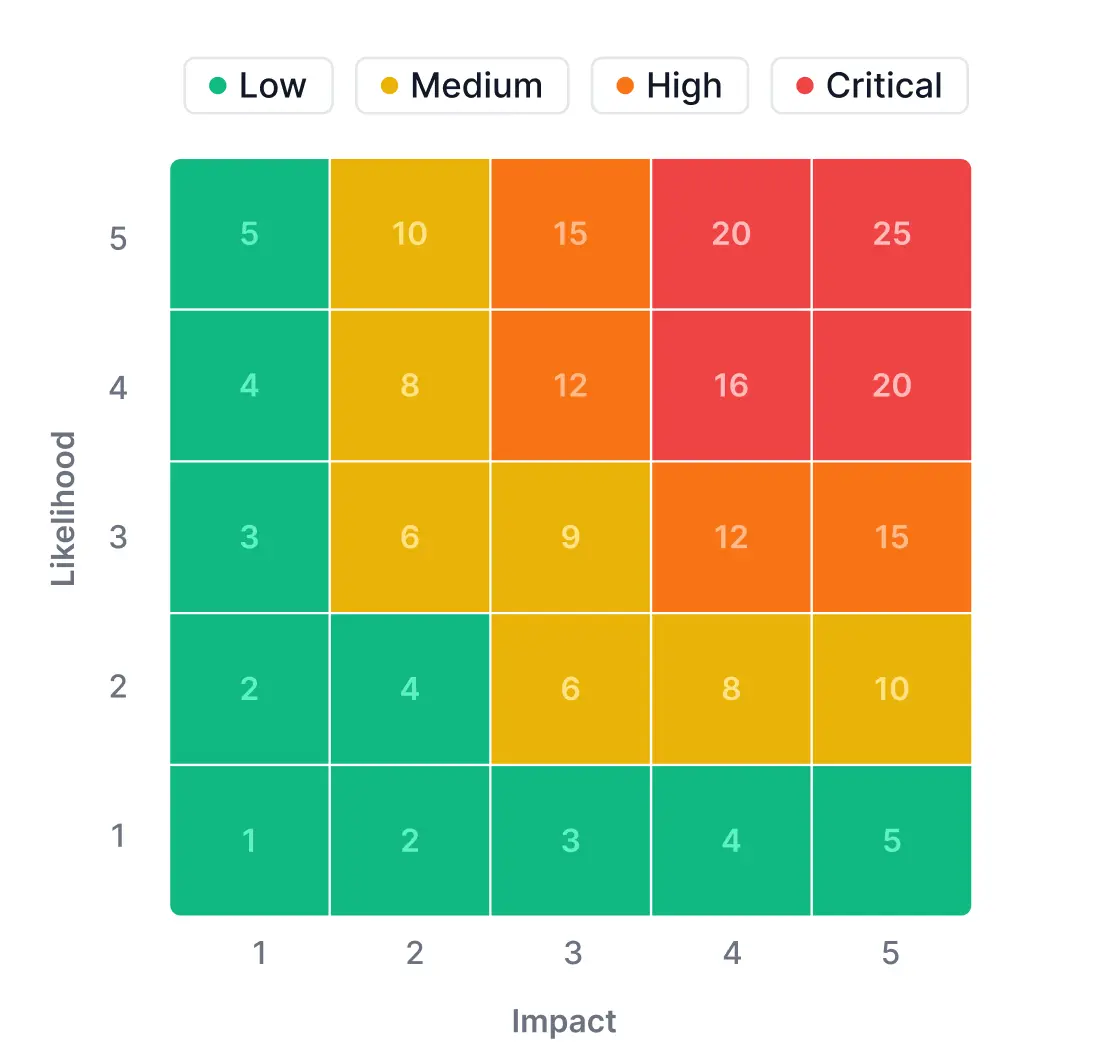 Each cell typically gets grouped into a band. A common approach uses low, medium, high, and critical or extreme, giving a reader a color-coded picture of where risks concentrate without needing to read every individual number on the grid.
3×3 vs. 5×5 risk matrix
A 3×3 matrix uses three levels per axis instead of five, producing 9 possible combinations rather than 25. It's simpler to build, faster to explain to a room full of stakeholders, and a reasonable starting point for smaller organizations or early-stage risk programs still building the habit of scoring risk consistently at all.
A 5×5 matrix allows more separation between risks that would otherwise land in the same broad category. Two risks that both score "high" on a 3×3 scale might land on very different cells, 12 versus 20, on a 5×5 scale, which matters when a team can only act on a handful of risks at a time.
Neither format is universally better. A 3×3 matrix that a team actually uses consistently, quarter after quarter, beats a 5×5 matrix that looks more sophisticated on paper but is too granular for anyone to apply the same way twice.
How to create and use a risk matrix
Building a risk matrix that actually gets used, rather than one that gets built once and forgotten, follows a fairly consistent sequence:
Identify the risks to assess. Pull from incidents, audits, supplier reviews, or direct team input. The goal is real candidates, not a hypothetical list assembled in a single brainstorming session. A register that only contains risks someone thought of in one meeting tends to miss exactly the risks that matter most.
Define likelihood and impact criteria. Write down what each level actually means for your organization before scoring a single risk against it. Skipping this step is the single most common reason two people score the same risk differently, since they're silently using different definitions of "likely" without realizing it.
Establish the scoring scale and thresholds. Decide how likelihood and impact combine into a score, and exactly where the boundaries between risk bands sit. Write the thresholds down somewhere everyone scoring risks can actually see them, not just in one person's head.
Assess each risk against likelihood and impact. Score consistently, and bring in more than one person's judgment on the higher-stakes risks specifically. A single assessor's blind spot becomes the whole organization's blind spot if nobody else weighs in.
Plot and prioritize risks within the matrix. The visual placement is the entire point of the exercise. It should make the highest-priority risks obvious within seconds, without anyone needing to read a supporting paragraph first.
Decide how high-priority risks should be addressed. Accept, reduce, transfer, or avoid, each risk needs an actual decision attached to it, not just a score sitting on a grid with no follow-up action.
Review scores when circumstances or controls change. A matrix that never gets revisited slowly drifts away from reflecting reality, until the day an incident happens on a risk the matrix still shows as low priority.
That sequence covers building and applying the matrix itself. The wider process it sits inside, identifying, assessing, treating, monitoring, and governing risk over time, is covered in more depth in our risk management frameworks guide, rather than duplicated here.
Risk matrix example
A worked example makes the mechanics concrete. Here's how five different risks might land on a 5×5 matrix:
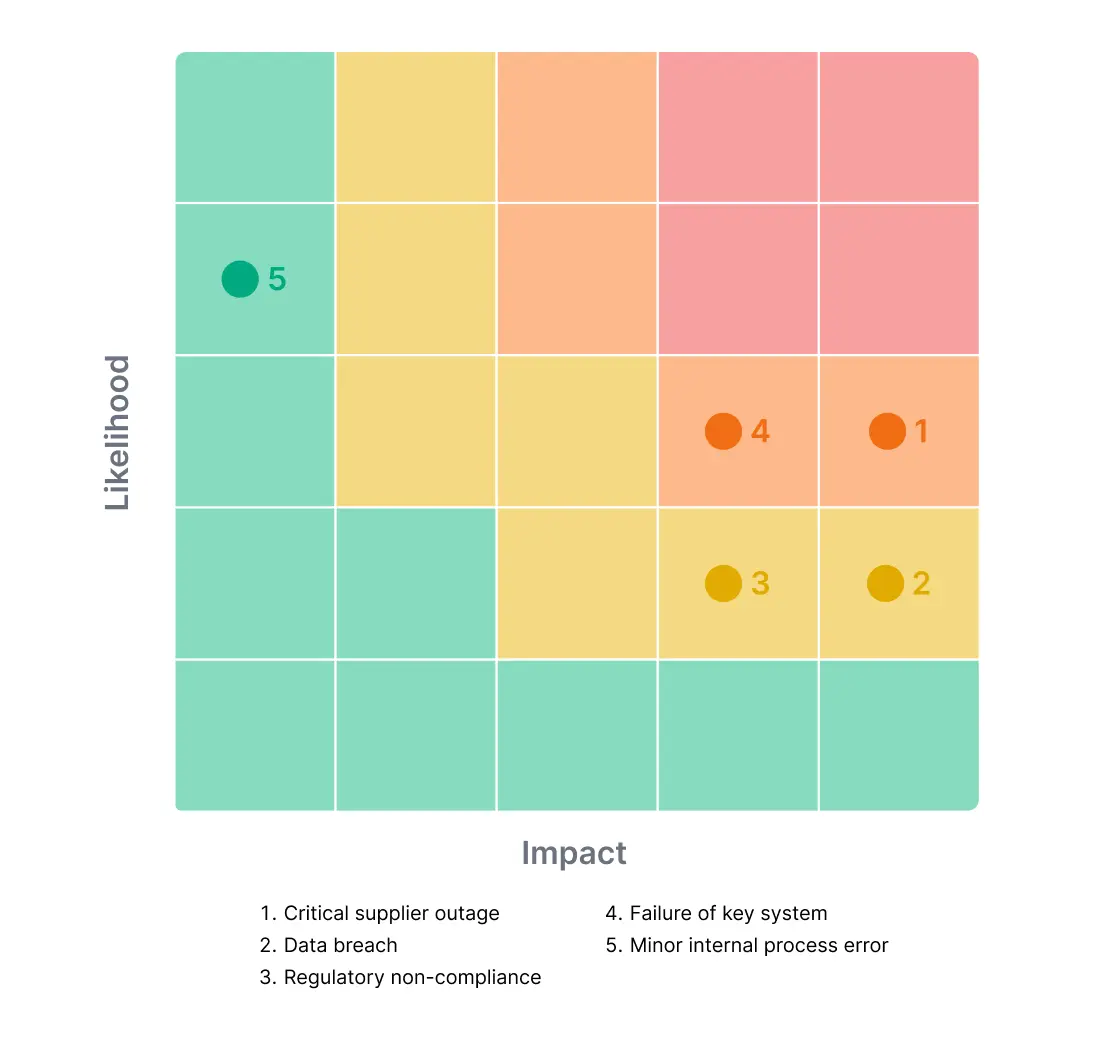 A few things are worth noticing in this table beyond the raw scores. The data breach scenario has a lower likelihood than the supplier outage, but its impact is rated at the maximum, reflecting the regulatory, financial, and reputational consequences that tend to compound once a breach becomes public. The minor internal process error, by contrast, is rated likely to happen again, but its impact stays low enough that it lands well outside the priority zone, exactly where it should sit.
These scores are illustrative, not prescriptive. The actual likelihood and impact for a "critical supplier outage" depends entirely on an organization's own supplier concentration, contract terms, and switching costs, not a number pulled from an example table written for a general audience.
Inherent vs. residual risk in a risk matrix
Inherent risk is the level of risk before any controls or mitigation are applied. Residual risk is what remains after those controls are actually in place and working.
The same risk can move meaningfully within the matrix once mitigation takes effect. Picture a supplier outage risk that starts at a likelihood of 4 and an impact of 5 on an inherent basis, before any safeguards exist. Once a backup supplier contract and active monitoring are in place, the likelihood might drop to 2 on a residual basis, while the impact stays the same, since the consequences if the outage still happens haven't changed, only the odds of it happening have.
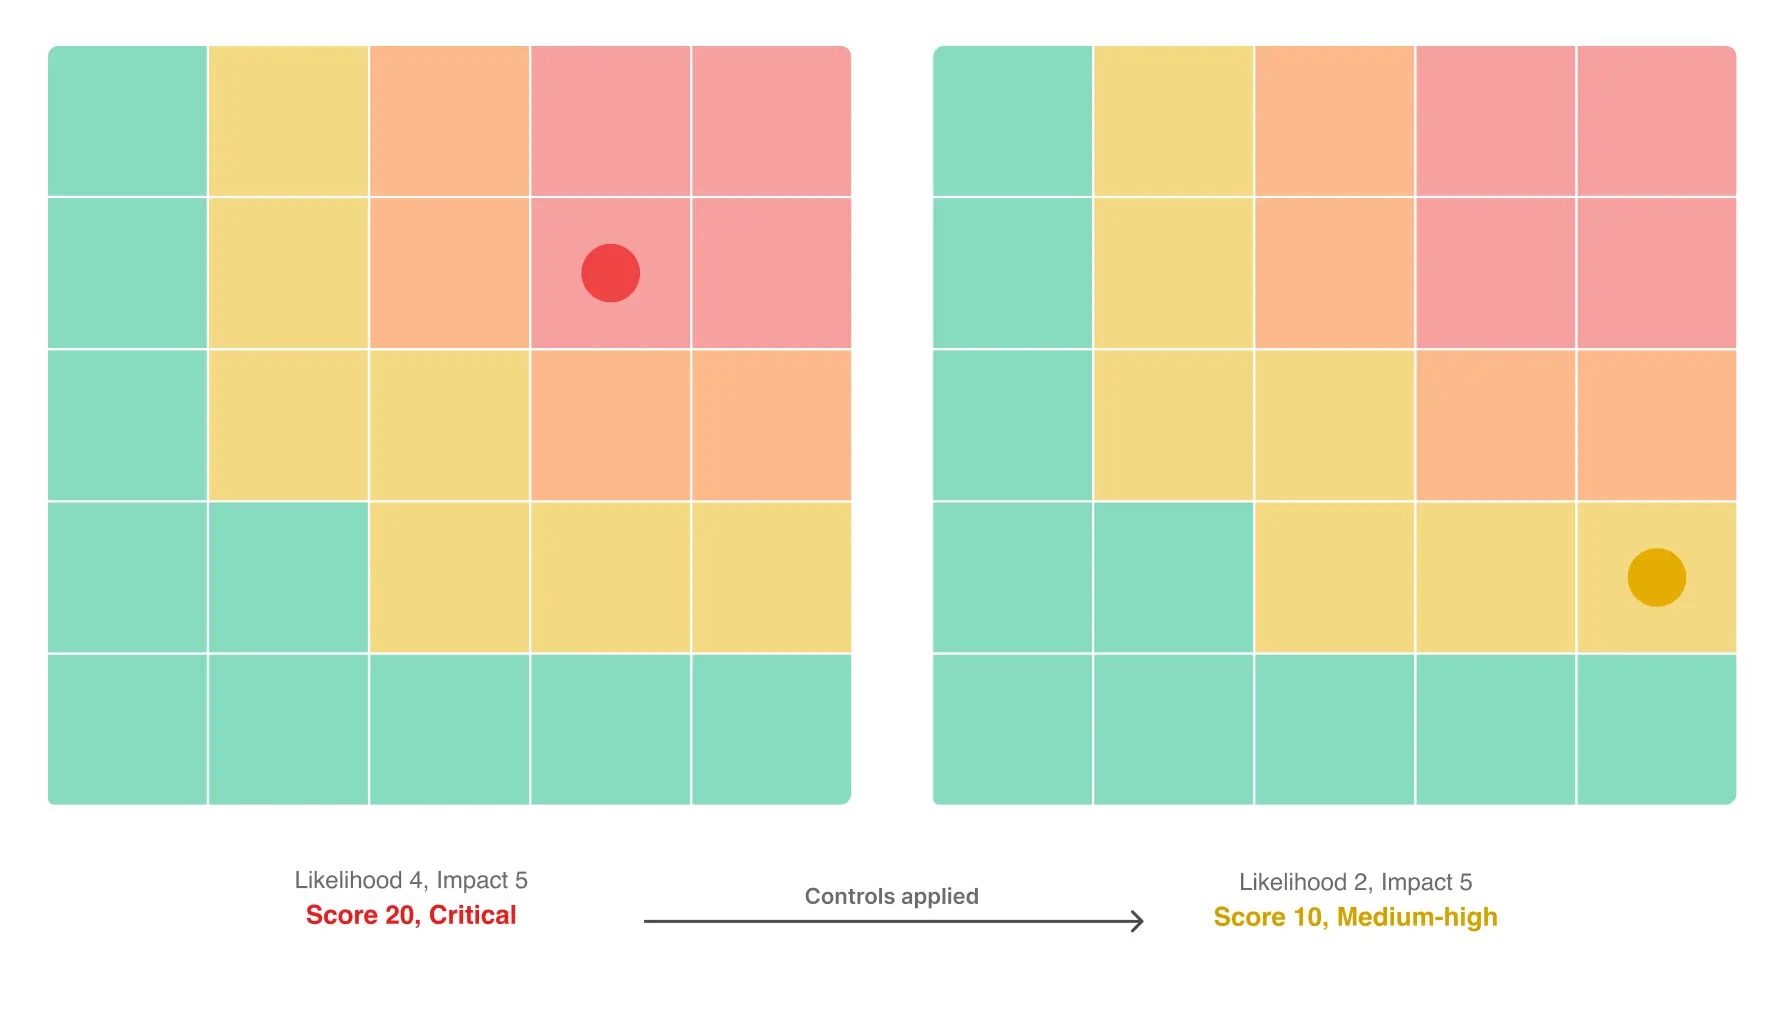 That movement is the actual point of tracking both figures. A risk matrix that only shows inherent risk tells you what could go wrong in a worst case. One that also shows residual risk tells you something different: whether what the organization is actually doing about it is working, or just looks like it is on paper.
What are the benefits of a risk matrix?
Used well, a risk matrix delivers several concrete benefits:
Makes complex risk information easier to visualize. A grid with color-coded cells communicates priority faster than a paragraph of narrative ever could, especially to someone seeing the risk landscape for the first time.
Creates a consistent structure for comparing risks. Without a shared framework, different people end up judging severity by gut feel, inconsistently, from one risk to the next, even within the same team.
Helps prioritize where limited mitigation resources actually go. Budget and attention are finite. A matrix makes the trade-offs explicit instead of implicit, so a decision to focus on one risk over another has a visible reason behind it.
Makes risk information easier to communicate to leadership. A board or leadership team can scan a matrix in a way they can't scan a long risk narrative, which matters when their attention for any single agenda item is measured in minutes.
Provides a common scoring language across teams. IT, legal, and operations can disagree about a risk's exact score, but at least they're arguing about the same two numbers, not talking past each other with different vocabulary entirely.
Helps identify risks that exceed the organization's stated tolerance. A defined risk appetite only means something once it's compared against an actual score, rather than staying an abstract statement in a policy document nobody references.
None of that makes the underlying judgment objective. A risk matrix organizes subjective assessments consistently. It doesn't remove the subjectivity from them, and treating it as though it does is where a lot of matrices quietly stop being useful.
What are the limitations of a risk matrix?
A risk matrix is a useful tool, not a precision instrument, and it's worth being direct about where it genuinely falls short:
Likelihood and impact ratings are inherently subjective. Two experienced assessors can score the exact same risk differently. Neither one is necessarily wrong. They're just weighing the same facts through different experience.
Different risks can land on identical scores despite very different profiles. A likelihood of 3 with an impact of 4, and a likelihood of 4 with an impact of 3, both score 12. They represent genuinely different kinds of exposure that deserve different responses, not the same one.
Simple scoring can create a false sense of precision. A single number sitting in a colored cell can look more rigorous than the judgment behind it actually was. The grid format itself lends an air of objectivity that the underlying estimate rarely earns.
A matrix may not capture complex dependencies or fast-changing risks. Static scores struggle with risks that shift quickly. They also struggle with risks that only matter in combination with something else happening at the same time.
Clear scoring criteria help. So does a consistent methodology applied the same way every time, and supporting evidence behind each score. None of that turns a risk matrix into a substitute for deeper quantitative analysis where that level of rigor is actually needed, particularly for risks with major financial or safety consequences attached to them.
Risk matrix vs. risk register: What's the difference?
A risk matrix is primarily a visual assessment and prioritization tool. A risk register holds the wider information actually needed to manage a risk over time: a description, a named owner, existing controls, mitigation actions, and current review status.
The two aren't alternatives to choose between. A risk register without a matrix makes prioritization harder to see at a glance, since everything lives in rows of text with no visual hierarchy. A matrix without a register has no record of who owns a risk or what's actually being done about it, only where it sits on a grid. Most working risk processes use both together, with the matrix acting as a visual summary layer sitting on top of the register's underlying detail.
Picture a "critical supplier outage" risk that scores 15 on the matrix. The matrix tells a reader that's a high-priority risk worth attention. It doesn't say who owns fixing it, what the backup supplier arrangement actually looks like, or when that arrangement was last tested. That detail lives in the register entry behind the score, not on the grid itself.
How often should a risk matrix be updated?
A risk matrix should be reviewed whenever the underlying risk environment changes, not treated as a static document that gets finished once and revisited only out of habit once a year.
Common triggers for review include a new incident, a newly implemented control, a change in suppliers, a regulatory development, an organizational change, or simply new information that shifts how likely or severe a risk actually turns out to be.
There's no universal review cadence that fits every organization equally well. The right frequency depends on an organization's risk profile and its governance requirements, not a generic best practice borrowed from a template built for a different kind of business entirely.
How Formalize supports risk matrices and risk assessment
Most risk matrices start life in a spreadsheet, and that works for a first pass. The friction shows up later: nobody owns keeping it current, and within a quarter, the matrix on the wall stops matching whatever's actually changed since.
Formalize's Risk Intelligence platform keeps the matrix connected to the rest of the risk program:
Matrices from 3×3 to 7×7, configured per risk type, so a simple category and a complex one don't have to share the same grid.
Custom axis naming, so likelihood and impact can be relabeled to match whatever terminology a framework already uses.
Sum or Multiply scoring, matching how an organization's own methodology actually calculates a score.
Risks connected directly to systems, suppliers, contracts, and controls, so a score reflects what's actually changed, not what a spreadsheet said last quarter.
Approval flows, so a risk version requires sign-off before it's finalized.
One honest scope note: like most risk platforms, Formalize fits most naturally with methodologies built around likelihood and impact. Highly specialized approaches, such as separate threat-and-vulnerability modeling common in some cybersecurity frameworks, currently need more of a workaround than a native fit.
Find out how Formalize can help you
Explore Risk Intelligence to see how a configurable matrix looks against your own risk register, or book a demo to walk through it directly with your own data.